Most of them are outdated, but provide historical design context.
They are not user documentation and should not be treated as such.
Documentation is available here.
ATTENTION: This page is no longer up to date. Please follow the link for the updated documentation:
oVirt Metrics - Installation Guide
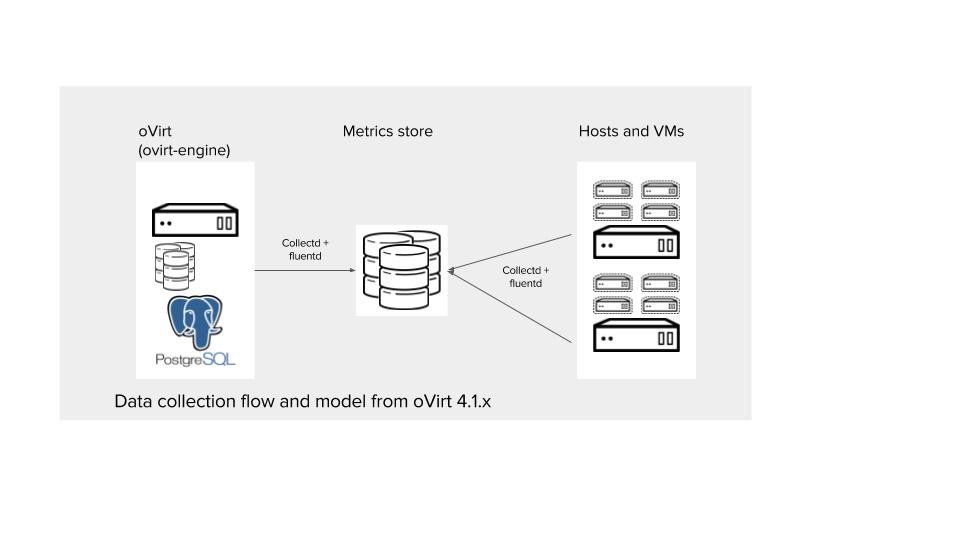
oVirt metrics store
The oVirt metrics store is based on OpenShift Logging (Elasticsearch, Kibana, Fluentd, Curator).
oVirt Metrics Store Setup
Note: Currently, the oVirt Metrics Store should be installed on a new machine, separate from the engine. It can be installed on a dedicated VM.
Metrics Store Machine Prerequisites
For an oVirt environment with 50 hosts:
- 4 CPU cores, 16GB RAM memory .
- We recommends using SSD disks.
- CentOS 7.5.
- Preallocated 500GB partition - It will be used for persistent storage. Use a partition other than root (/) to avoid filling up the partition, for example, /var.
-
Add the Metrics Store Machine FQDN to your enterprise hostname resolution system, for example, DNS and add a wildcard dns prefix for this address.
- Please make sure to follow the OpenShift
mastersprerequisites
Update config.yml file
-
Copy /etc/ovirt-engine-metrics/config.yml.example to config.yml.
On the oVirt engine machine, run:
# cp /etc/ovirt-engine-metrics/config.yml.example /etc/ovirt-engine-metrics/config.yml -
Update the file /etc/ovirt-engine-metrics/config.yml located on the engine machine, with the following lines:
# vi /etc/ovirt-engine-metrics/config.yml.d/config.yml -
Update the values to match the details of your specific environment:
-
ovirt_env_name:Please update this variable.Environment name. It is used to identify data collected in a single central store, sent from more than one oVirt engine.
Use the following convention:
- Include only alphanumeric characters and hyphens ( “-“ ).
- Name cannot begin with a hyphen or a number, or end with a hyphen.
- Maximum of 49 characters. Wildcard patterns (e.g. ovirt-metrics*) cannot be used.
-
elasticsearch_host:(required - no default value)Address or hostname (FQDN) of the Elasticsearch server host.
Variables for installing the oVirt metrics store
openshift_distribution:(default:origin)openshift_ansible_files_path:(default:/root)ovirt_elasticsearch_mounted_storage_path:(default:/var/lib)engine_url:(Mandatory. No default )engine_user:(Mandatory. No default )`engine_password:(Mandatory. No default )engine_insecure:(default:true)engine_cafile:(No default )public_hosted_zone:(No default )create_host_entry:(default:false)root_password:(default:admin)ovirt_cluster_name:(default:Default)openshift_ovirt_storage_domain_name:(default:hosted_storage)openshift_ovirt_bastion_machine_name:(default:metrics-store-installer)openshift_ovirt_all_in_one:(default:true)number_of_openshift_master_vms:(default:1)number_of_openshift_node_vms:(default:0)number_of_openshift_compute_vms:(default:0)number_of_openshift_lb_vms:(default:0)openshift_logging_es_cluster_size:(default: 1)openshift_logging_es_number_of_replicas:(default: 0)elasticsearch_disk_size:(default:500GiB)openshift_logging:(default:true)template_name:(default:rhelguest76)template_memory:(default:4GiB)template_cpu:(default:2)
Additional mandatory variables for Red Hat Virtualization:
qcow_url:( No default )rhsub_user:( No default )rhsub_pass:( No default )rhsub_pool:( default: [] )qcow_url:( No default )rhsub_user:( No default )rhsub_pass:( No default )rhsub_pool:( No default )openshift_rhsub_pool:( No default )oreg_auth_user:( No default )oreg_auth_password:( No default )
Run ovirt-metrics-store-installation playbook
This playbook creates the vm(s) and generates the files required for the metrics store installation and copies them to the metrics store machine.
    # /usr/share/ovirt-engine-metrics/setup/ansible/configure_ovirt_machines_for_metrics.sh \
    --playbook=ovirt-metrics-store-installation.yml
Metrics Store Installation
Please follow the metrics store installation instructions: Metrics Store setup on top of OpenShift
Once you have finished this step, you should have:
- Kibana -
https://kibana.{elasticsearch_host} - OpenShift portal -
https://{elasticsearch_host}:8443
oVirt Hypervisors and Engine Setup
Please follow the instructions: Deploy Collectd and Rsyslog on Hypervisors and Engine
Example Dashboards
Kibana should be available at https://kibana.{elasticsearch_host}
Dashboard examples include System Dashboard, Hosts Dashboard, VMs Dashboard, Processes Dashboard.
If you wish to import dashboards example, you will need to import visualization and dashboards manually from the Kibana UI.
-
Copy the /etc/ovirt-engine-metrics/dashboards-examples directory to your local machine.
-
Go to the Kibana UI, to the
settingtab ->indices. -
In the Kibana UI, go to the
settingtab ->objects. -
Import the
Searches. -
Import the
Visualizations.
Note: If you get an error while loading the Visualizations, check your hosts and make sure Collectd and Rsyslog services are running with no errors. After that try loading the Visualizations again.
-
Import the
Dashboards. -
Select the
project.ovirt-metrics-<ovirt-env-name>.<uuid>index. -
Press the orange button,
Refresh field list. -
Do steps 7 and 8 for the
project.ovirt-logs-<ovirt-env-name>.<uuid>index.
You are done! Go to the Dashboard tab in the Kibana UI and choose a dashboard.
Currently there are 3 example dashboards:
-
System Dashboard -
https://kibana.{elasticsearch_host}/app/kibana#/dashboard/System-Dashboard -
Hosts Dashboard -
https://kibana.{elasticsearch_host}/app/kibana#/dashboard/Hosts-Dashboard -
VMs Dashboard -
https://kibana.{elasticsearch_host}/app/kibana#/dashboard/VMs-Dashboard
Viewing Saved Dashboards
Once you have created and saved a dashboard, or imported the sample dashboards, you can display them in the Dashboard tab:
- Click the Dashboard tab.
- Click the Load Saved Dashboard button to display a list of saved dashboards.
- Click a saved dashboard to load and view it.