Most of them are outdated, but provide historical design context.
They are not user documentation and should not be treated as such.
Documentation is available here.
Nagios Integration
Summary
Currently, administrators of gluster deployments have no easy mechanism to track the health of a Gluster installation - that is, when a brick goes down, split brain occurs, disk is full etc. oVirt provides a poll based mechanism that uses the existing Gluster CLI to identify the volume’s status and node status. This is not sufficient to get data about the issues like split-brain, quota exceeded etc. Also, there’s a 5 min polling interval for brick status and hence the data displayed in oVirt may be considered stale. We need to provide an efficient way for:
- Monitoring of critical entities such as hosts, networking, volumes, clusters and services
- Alerting when critical infrastructure components fail and recover, providing administrators with notice of important events. Notification for Alerts can be delivered via email, SNMP. Alerts can be either seen on Nagios UI or on oVirt UI
- Reports providing a historical record of service outages, events and notifications for later review, through Nagios UI interface.
- Trending graphs and reports
Since most enterprises already have or are familiar with existing monitoring frameworks like Nagios, we plan to integrate our monitoring solution with these.
Owner
- Feature owner: Nishanth Thomas nthomas@redhat.com
Current Status
- Status: Development
- Last updated date: ,
Detailed Description
The diagram below provides an overview about the proposed architecture
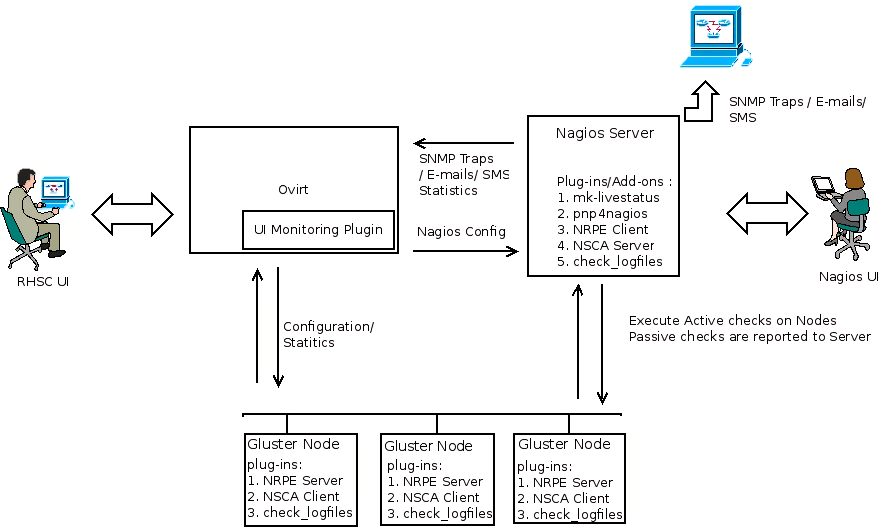 Nagios monitors storage clusters to ensure clusters, hosts, volumes, and software services are functioning properly. In the event of a failure, Nagios can alert technical staff of the problem, allowing them to begin remediation processes before outages affect business processes, end-users, or customers. This is achieved through the checks(Active/Passive) and these checks executed on the monitored resources. Nagios Analyzes the check result and if there is any event that meets the Alert definition, it would be flagged as an Alert on the Nagios server or on oVirt (if it’s deployed) and the appropriate configured notifications (Email, SNMP Traps) will be sent. , In the proposed architecture, we have three main functional blocks- oVirt, Nagios and the Gluster nodes. Nagios server will have the Nagios core installed and a set of infrastructure plugins/addons to execute the checks, process the check result and generate notifications. Gluster nodes will have the infrastructure plugins/addons for check execution and also the plugins which implement the check logic. oVirt will implement (As a UI Plugin) the alert dashboard and the plugins for trending and reporting so that administrator gets a clear view of what is happening in the storage network. External management stations can subscribe for SNMP traps from Nagios so that they get alerted as and when something goes wrong.
At a high-level, each functional block will have the following software components:
Nagios Server
- Nagios Core Installed
- NSCA Server
- NRPE Client
- Mk-Livestatus
- PNP4Nagios
- NetSnmp
- Plugins that implements the check logic and also process the check result(like custom event handlers)
Gluster Nodes
- NRPE Server
- NSCA Client
- Pugins that implements the check logic.
oVirt
- UI plugins for alert dashboard and trends. The Trends UI plugin is planned for the first phase.
- The oVirt Monitoring UI Plugin can also be used to view the Nagios plugin data within oVirt
Dependencies / Related Features
- Nagios Core
- Nagios Addons - NRPE , NSCA, MK Livestatus, PNP4Nagios etc
- Nagios plugins
- Ovirt UI Monitoring Plugin
Packaging
- Nagios core will not be packaged and should be installed along with Ovirt
- Nagios addons and plugins will not be packaged and installed. This needs to done separately on the the monitoring nodes and the server
User Flows
External events from Nagios
Status: Planned
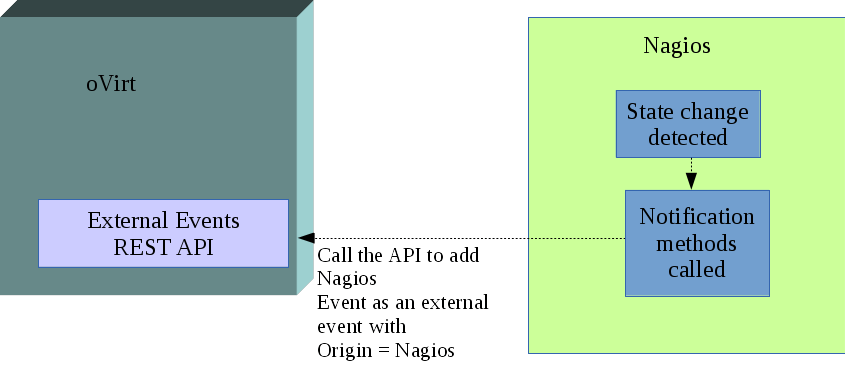
If oVirt is integrated with Nagios for monitoring, any alert/event detected by Nagios needs to be sent to oVirt. This can be done through notification methods.
A new contact will be created which will point to the oVirt REST API entry point and will have the link to the certificate and credentials required to access the API.
The oVirt REST API contact can be associated with the notification method that will post the event details to be added as an external event in oVirt. Whenever a state change occurs that requires notification, this event with all its details is sent to oVirt REST API as an external event. The external event API will create an Audit Log entry for this event and mark the origin as Nagios. The oVirt Dashboard will display these events after applying various filters for cluster and volume events.
Brick, Volume and Cluster State
Cluster and volume state is determined by the state of its constituents. Ovirt will get all alerts from Nagios, and use these alerts to show a consolidated status. On an external event, further action will be taken to update the status of Brick, Volume and Cluster.
Brick is a logical entity, which provides basic storage facility for gluster-cluster. A brick can be in one of the following states
- UP – If Brick service is up and brick storage has not crossed the Critical threshold
- DOWN – If either Brick service is down or brick has consumed all the storage capacity of the brick
Volume is treated as a logical entity that serves data, and it’s state needs to reflect this purpose. Volume can have the following states
- UP – Volume is operational and meeting all data serving requirements
- UP-DEGRADED – Volume is operational but not performing to full optimization. This is applicable to replicated volumes, when a replica brick is down
- UP-PARTIAL – Volume is operational but some parts of the file system could be inaccessible. This could happen when a sub-volume is down. Applicable for both Replicated and Distributed volumes.
- DOWN – Volume is crashed or all bricks are down.
- STOPPED – Volume is shut-down by the Admin intentionally ( Note : For a state change of this nature, no alerts should be generated and no notification needs to be sent. But the event should be generated )
The volume states are determined by the participating brick states.
In a cluster, there are services that provide additional functionality like NFS – for NFS access SMB – for SMB access CTDB – for High availability of SMB and NFS SHD – Self Heal daemon Glusterd – Gluster management daemon Quota – Enforcing quota limits on volume Geo-replication – To geo-replicate volume across clusters
Nagios Dashboard and Trends
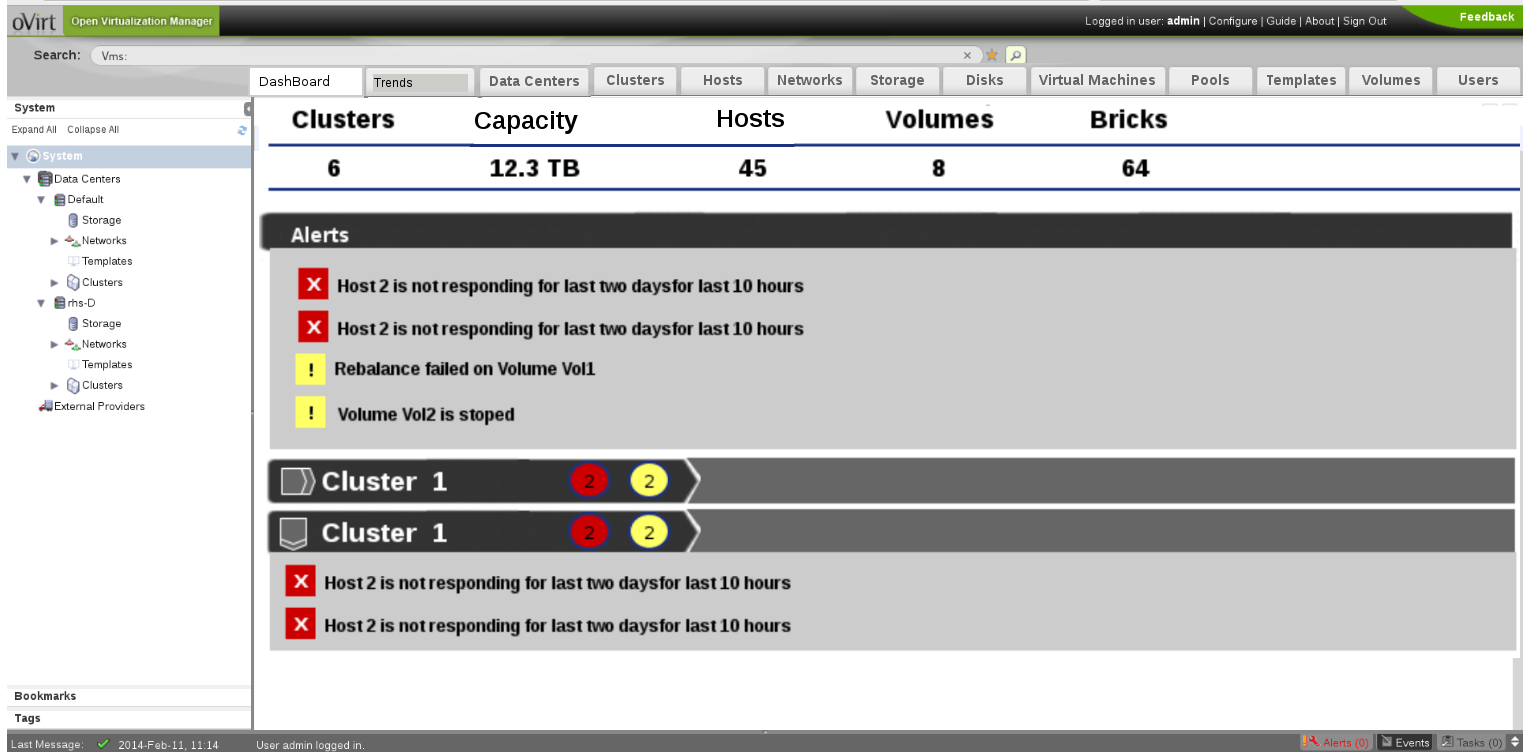
Dashboard and trends tabs will be added to the oVirt-UI through ui-plugins approach. All the alerts pushed from Nagios to oVirt will be shown in the dashboard. It will also show a summary of the entities currently being manged by oVirt like Hosts, Volumes and Bricks. Alerts will be shown for individual clusters as well. This is planned for a subsequent release.
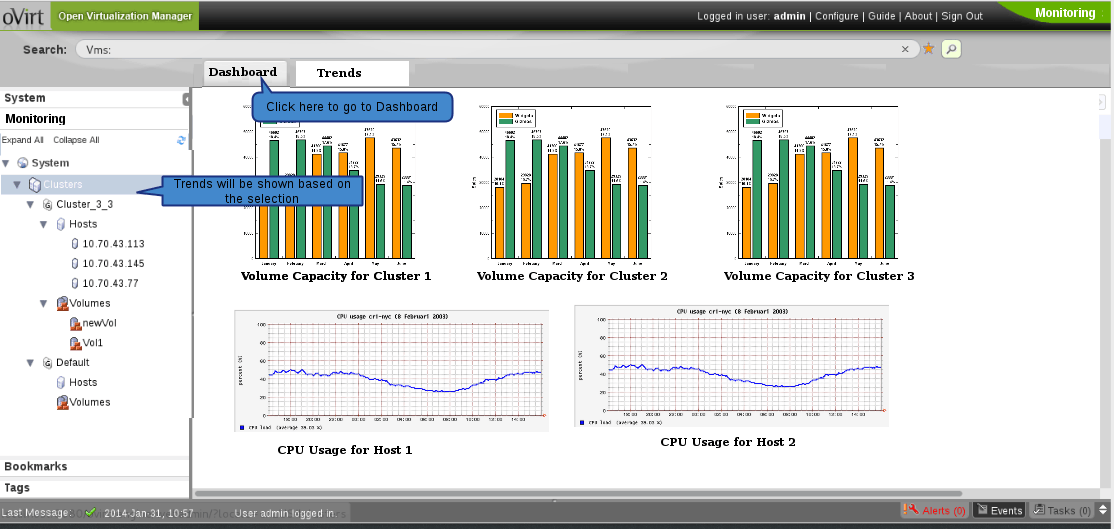
Trends tab will show the graphs from pnp4nagios. The graphs will be displayed based on the user selection in System Tree. Available from 3.5 If user has selected a particular cluster, the volume utilization graph will be shown for all the volumes in the cluster. In the same way, when a volume is selected in the system tree, brick utilization graph for all the bricks part of that volume will be shown.
The graphs by default will be shown for last 24 hours. The user select a custom time range for displaying the graph data. Graphs shown in the page can be either printed directly or can be saved as a report in PDF format.
Nagios Specific
Auto Configuration/ Auto Discovery on Nagios
- Nagios works with configuration files. It uses configuration files to schedule the jobs to execute the checks(to collect monitoring data), send alerts and notifications
- The configuration files spread over multiple files and directories.
- Nagios configuration needs to be updated when there is any addition/deletion/modification of any logical or physical entities from Ovirt.
- This will be done through a script on Nagios server that will execute the “gluster peer status” and “gluster volume info” commands to discover new entities and update the configuration information
Active Checks on Remote Nodes
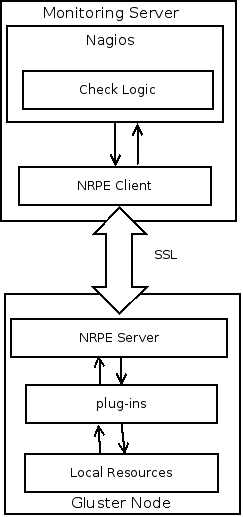
- Active checks are initiated by the Nagios and run on a regularly scheduled basis.
- To execute active checks on gluster nodes, NRPE add-on will be used
- NRPE will execute plug-ins to monitor local resources/attributes like disk usage, CPU load, memory usage, etc. on the gluster nodes
- Check results will be send back to the Nagios server and if there is a service state change, alerts/traps will be send based on the configuration.
Passive checks on Remote Nodes
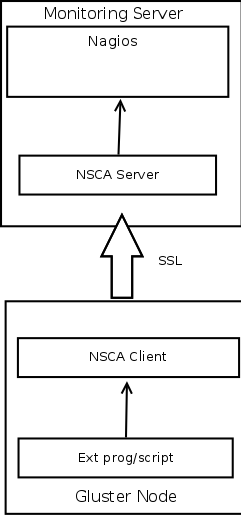
- Passive checks are initiated and performed external applications/processes and results are submitted to Nagios for processing
- To execute passive checks on gluster nodes, NSCA add-on will be used
- An external application(crontab / application hook / syslog monitor ) checks the status of a host or service.
- The external application passes the results to the NSCA client, which in turn send it to the NSCA server on the monitoring monitoring server.
- Nagios server will process the service check result and execute the the specific action if configured.
Generating SNMP Traps/Alerts From Nagios Server
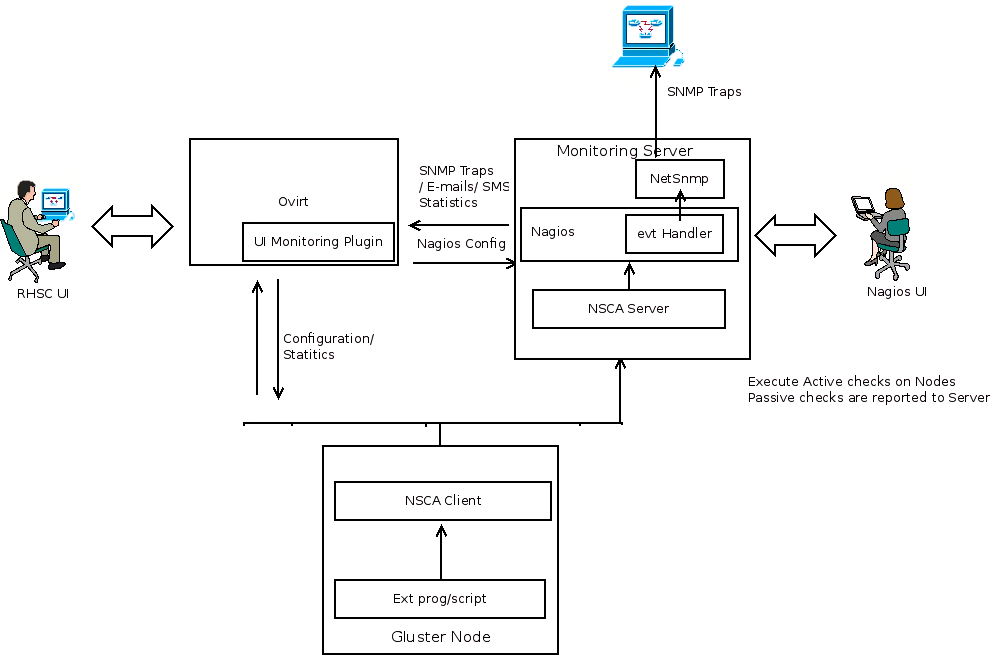
- External Program/script/cron jobs or Application hooks monitor the status of specific resources/services.
- The results are passed on to the NSCA client which in turn pass the results to NSCA server on the monitoring server.
- Nagios server will process the result and invokes the event handler script configured for generating the SNMP traps.
- Event handler script generate the SNMP traps with the help of the SNMP trap generator(Netsnmp or anything similar).
- If there is a service state change, Nagios will send alerts(SMS, Email) based on the configuration.
Alternatively Traps/alerts can be generated based on the result of an active check
Generating traps/alerts Based on the Syslog Entries
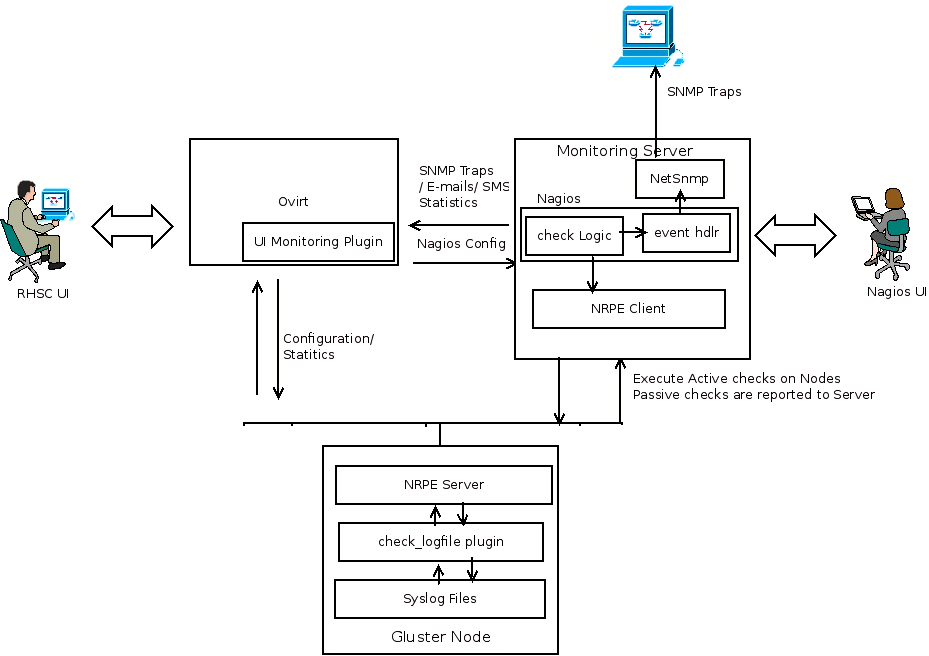
- rsyslog’s omprog filter is used to send passive checks to Nagios server whenever logs of interest appear in syslog.
- omprog allows for the execution of external scripts and this is used to send an NSCA check result
- Currently implemented for quorum and quota logs
Resources/Entities Monitored in the cluster
- List of Physical Resources that need to be monitored :
- Hosts (Servers)
- CPU
- Memory/Swap
- Network
- Disks
- List of Logical Resources that need to be monitored :
- Cluster(Gluster specific)
- Volume(Gluster specific)
- Brick(Gluster specific)
- Parameters that should be monitored for logical and physical resources :
- Operational Status
- Utilization
- Monitoring of Access Services such as:
- SMB
- CTDB
- NFS
- Monitoring of gluster specific status such as:
- Self-Heal(Gluster specific)
- Geo-Replication(Gluster specific)
- Cluster Quorum
- TODO: Alerting mechanisms needed for spilt-brain
HOW TO
This installation has been currently tested on Fedora20 / RHEL6
Pre-requisites:
- Fedora20/ RHEL 6 server to host Nagios server
- Two or more nodes in a gluster trusted pool. (Note: In a pinch for resources, Nagios server can also be installed on one of the nodes)
Installing Nagios plugins on the nodes
To install the gluster-nagios-common and gluster-nagios-addons packages, add the repo at download.gluster.org repository
On Fedora
# yum install gluster-nagios-common gluster-nagios-addons
On RHEL6
RHEL users must add the EPEL yum repository to obtain the dependency packages
    # yum install http://download.fedoraproject.org/pub/epel/6/i386/epel-release-6-8.noarch.rpm

    # yum install gluster-nagios-common gluster-nagios-addons
Make sure that the node can receive nrpe requests from nagios server. You can do this by editing /etc/nagios/nrpe.cfg and adding the nagios server host ip/name to allowed_hosts
# service nrpe restart
Installing Nagios server addons for monitoring
To install the gluster-nagios-common and nagios-server-addons packages, add the repo at download.gluster.org repository
On Fedora
# yum install gluster-nagios-common nagios-server-addons
This will install dependencies like nagios, nrpe, nsca, mk_livestatus if not already installed
On RHEL6
RHEL users must add the EPEL yum repository to obtain the dependency packages
# yum install http://download.fedoraproject.org/pub/epel/6/i386/epel-release-6-8.noarch.rpm

# yum install gluster-nagios-common nagios-server-addons
Make sure the http/s ports are accessible
# iptables -I INPUT 4 -p tcp --dport 443 -m state --state NEW,ESTABLISHED -j ACCEPT
# service iptables save
# service iptables restart
For mk_livestatus to work, SELinux needs to be in permissive mode.
Note: The below will not survive reboots
# setenforce 0
Run configuration script to detect the nodes/volumes in the gluster trusted pool and to create Nagios services for these
# /usr/lib64/nagios/plugins/gluster/discovery.py -c <name for your cluster> -H <hostname/ip of any node in your cluster>
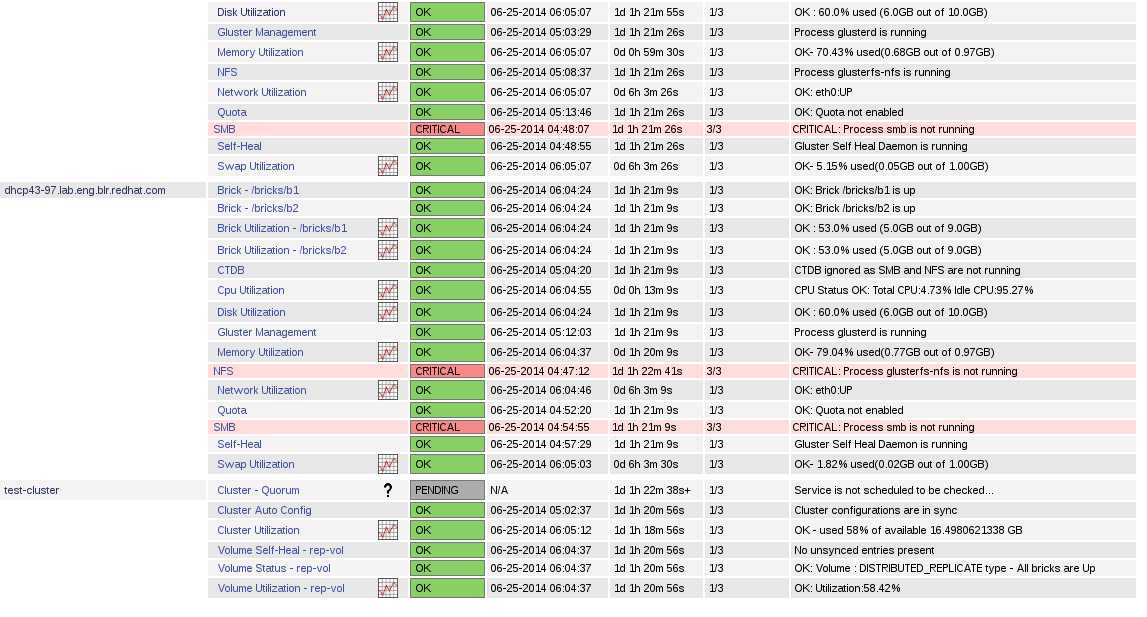
This will configure monitoring for gluster services on nodes in your cluster and the web UI should be accesible at
Instegrating with oVirt
Nagios integration is done via 2 options
Option 1. Trends plugin
Checkout the samples-ui-plugins project from gerrit.ovirt.org - sample-ui-plugins
Create a symlink to gluster-nagios-monitoring/src and gluster-nagios-monitoring/gluster-nagios-monitoring.json under /usr/share/ovirt-engine/ui-plugins
# ln -s <path to sample-ui-plugins>/gluster-nagios-monitoring/src gluster-nagios-monitoring
# ln -s <path to sample-ui-plugins>/gluster-nagios-monitoring/gluster-nagios-monitoring.json gluster-nagios-monitoring.json
Edit the /usr/share/ovirt-engine/ui-plugins/gluster-nagios-monitoring.json as below:
{
    "name": "GlusterNagiosMonitoring",
    "url": "plugin/GlusterNagiosMonitoring/start.html",
    "resourcePath": "gluster-nagios-monitoring",
    "config": {
                    "showDashboard": "true",
                    "messageOrigins":["http://ovirt-engine-hostname:80"], //path to ovirt-engine server
                    "pnp4nagiosUrl" : "http://nagios-server" //path to nagios server
                  }
}
You should now see a Trends tab and a Dashboard tab once logged into oVirt like below
Option 2 : Using the Monitoring-UI plugin
Install the oVirt Monitoring UI Plugin
The Gluster services will be available in a sub-tab under the cluster as well as each host.
Detailed Design
TO DO