Most of them are outdated, but provide historical design context.
They are not user documentation and should not be treated as such.
Documentation is available here.
Gluster Volume Performance Statistics
Summary
This feature provides the support for monitoring and measuring the performance of Gluster volumes and bricks.
Owner
- Feature owner: Sahina Bose sabose@redhat.com
- GUI Component owner: Anmol Babu anbabu@redhat.com
- Engine Component owner: Sahina Bose sabose@redhat.com
- QA Owner: Sudhir Dharanendraiah sdharane@redhat.com
Current Status
- Status:
- Gluster Volume Profile: Completed. Available from 3.5
- Gluster Volume Top: In Progress
- Last updated date: ,
Detailed Description
Top
Display results of the ‘gluster volume top’ command on GUI. GlusterFS Volume Top command allows you to view the glusterfs bricks’ performance metrics like read, write, file open calls, file read calls, file write calls, directory open calls, and directory read calls.
Gluster Volume Top has further details on this
VDSM Changes
- glusterVolumeTopOpen (volumeName, brickName=None, nfs=False, listCount=None/100?)
This receives volume-name, brick-name, list-count as a input and executes gluster volume top open command and return a dictionary which contains a list of file names (top number of list-count items) and its call count values. List count is an optional numeric parameter which helps to filter the number of items to be returned. Brick-name is also an optional parameter. If brick-name is not given, it returns all bricks info of the volume.
If nfs is True, then the top open output is per NFS server.
    Output dictionary which contains open fd count and maximum fd count: ```python
     {'statusCode' : CODE,
         'brickCount': BRICK-COUNT,
         'bricks': {BRICK-NAME: {'count':FILE-COUNT,
                                               'currentOpenFds': CURRENT-OPEN-FDS-COUNT,
                                                         'maxOpen': MAX-OPEN,
                                                         'maxOpenTime': MAX-OPEN-TIME,
                                                         'files': [{FILE-NAME: FILE-OPEN-COUNT}, ...]
                                                      }, ...} } ``` 2. glusterVolumeTopRead (volumeName,brickName=[ ], nfs=True/False?, listCount=None/100?)
This gives an output dictionary of a list of highest read calls on each brick. If brick name or list count is not given it works with the default value (all bricks, 100 files). This will use gluster volume top read gluster cli command internally.
- We can get the list of values either for all bricks or a specific brick
- glusterVolumeTopWrite (volumeName,brickName=[ ], nfs=True/False?, listCount=None/100?)
This provides the list of highest file write calls on a specific brick or the list of bricks based on the input request. This calls gluster volume top write gluster cli command internally to fetch the values.
- glusterVolumeTopOpenDir (volumeName, brickName=None, listCount=None)
This returns list of files which has highest open calls on directories of each brick. If brick name is not specified, then the metrics of all the bricks belonging to that volume will be displayed. This uses gluster volume top opendir gluster cli command.
- glusterVolumeTopReadDir (volumeName, brickName=None, listCount=None)
Uses gluster volume top readdir gluster cli command and returns the dictionary as below:
         Output dictionary: ```python
         {'statusCode': CODE,
                 'brickCount': BRICK-COUNT,
                 'topOp': TOP-OP,
                 'bricks': {BRICK-NAME: {  'count':READ-DIR-COUNT,
                                                              'files': [{DIR-NAME: DIR-READ-COUNT}, ...]
                                                           }, ...} } ``` 6. glusterVolumeTopReadPerf (volumeName, blockSize=None, count=None, brickName=None, listCount=None)
This functionality helps to identify disk performance based on specific block size
- if the block size and the count is not specified, it will give the output based on historical data.
- Proper validation is required before passing blockSize and count value to this function.
the output will be dictionary which contains a list of read throughput of files on each brick. (What if the (dd) file size (blockSize * count) exceeds the size limit of the brick?)
- The brick name parameter is an optional one. This will not accept a list of brick names.
The values of blockSize and count will be passed to an appropriate gluster cli command and the gluster cli command will initiate a dd for the specified count and block size and measures the corresponding throughput.
- glusterVolumeTopWritePerf (volumeName, blockSize=None, count=None, brickName=[], listCount=100)
This provides write throughput of files on a specific brick/brick-wise
Entities
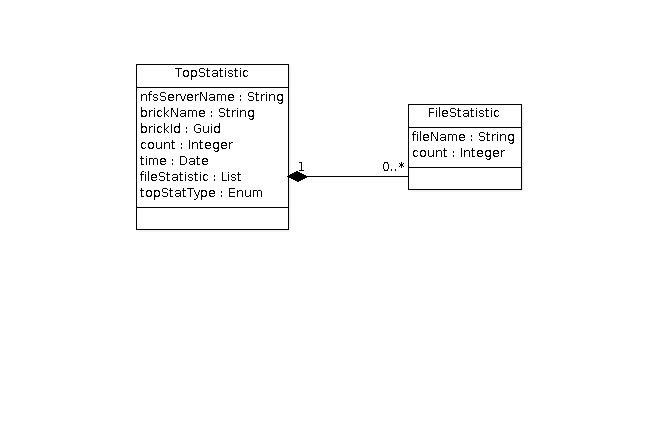
\1
- OPEN
- READ
- WRITE
- OPENDIR
- READDIR
- READ-PERF
- WRITE-PERF
REST API
- GET:
/api/clusters/<cluster-id>/glustervolumes/<volume-id>/top;type=<TopStatisticType>- Other matrix parameters
- nfs=true/false
- blocksize
- count
- Other matrix parameters
- GET:
/api/clusters/<cluster-id>/glustervolumes/<volume-id>/bricks/<brick-id>/top;type=<TopStatisticType>
Profile
Display results of ‘gluster volume profile’ command on the GUI.
Gluster volume profile can be used to diagnose performance issues with any gluster volume. To start diagnosis, the user needs to start profiling on the volume
Once profiling is enabled, the profile info can be viewed at intervals and can be used for diagnosis.
Once diagnosis is complete, profiling needs to be stopped on the volume.
See Gluster Volume Profile for detailed information on gluster volume profile
User Flows
Volume profiling can be started from the Volumes tab, by selecting a volume
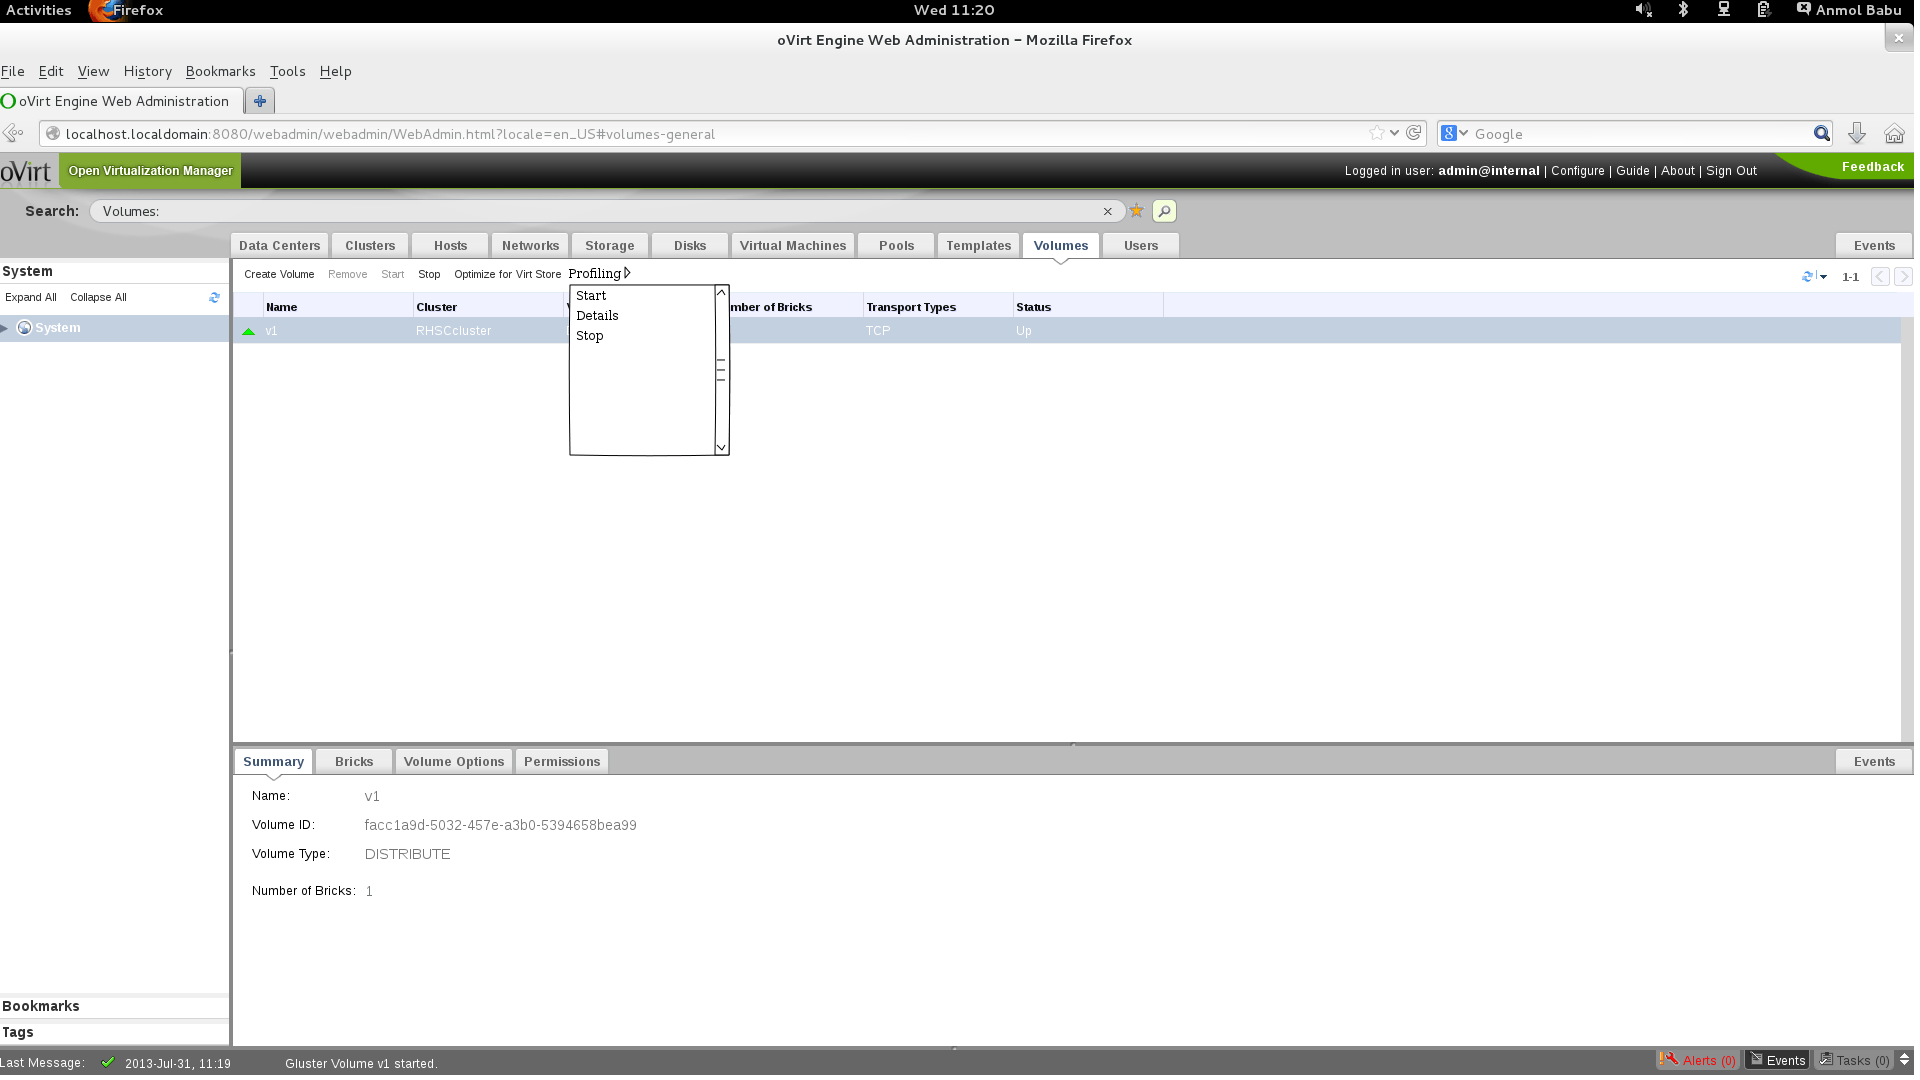
User can start profiling, view profile info and stop profiling using this sub menu
To view the profile info, “Details” sub-menu of the Profiling menu needs to be clicked. This will show a pop-up dialog like below
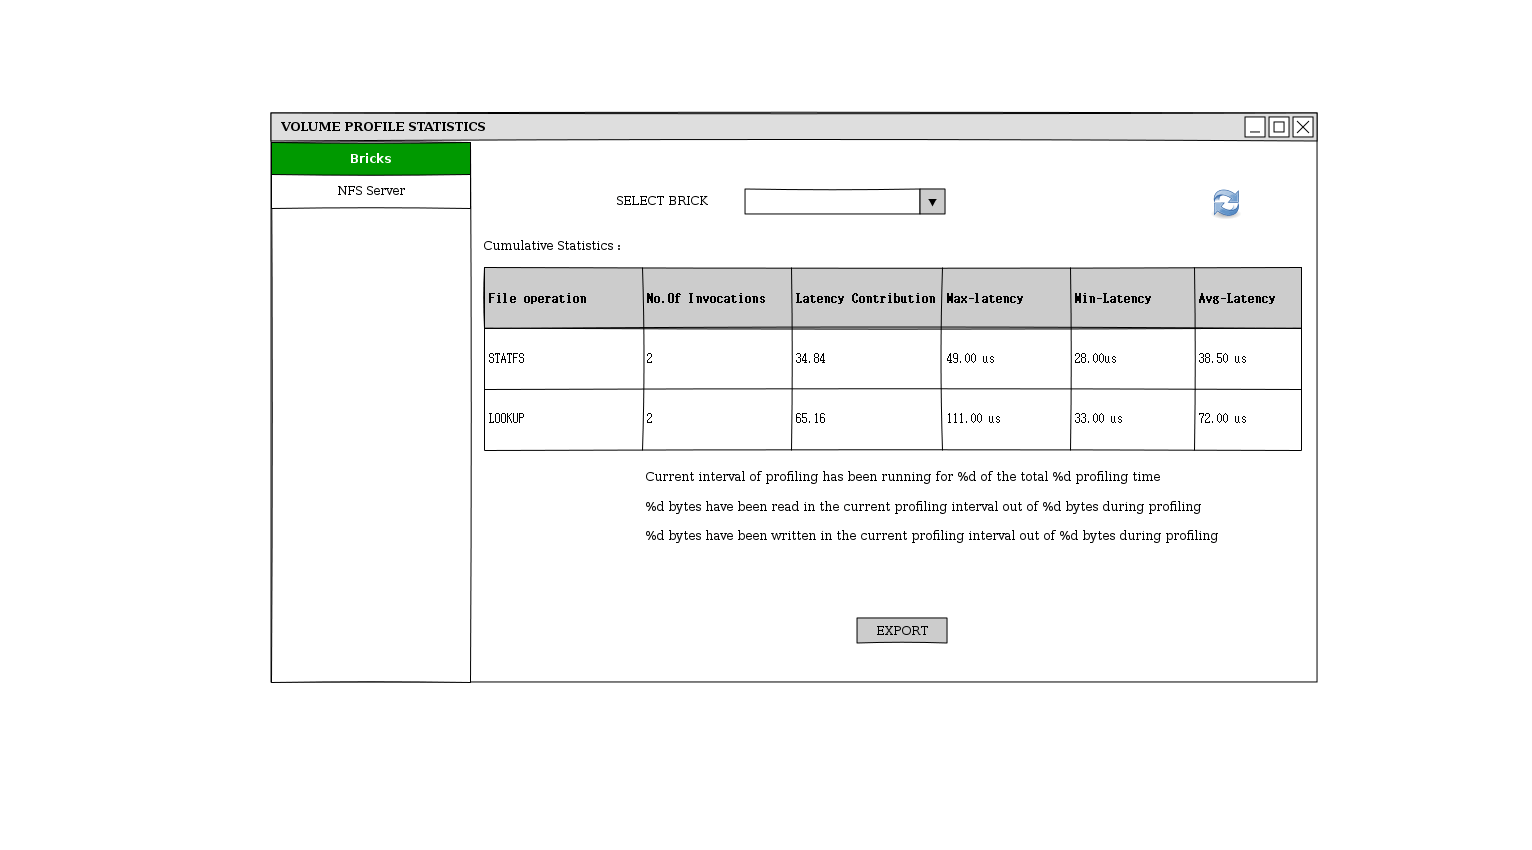
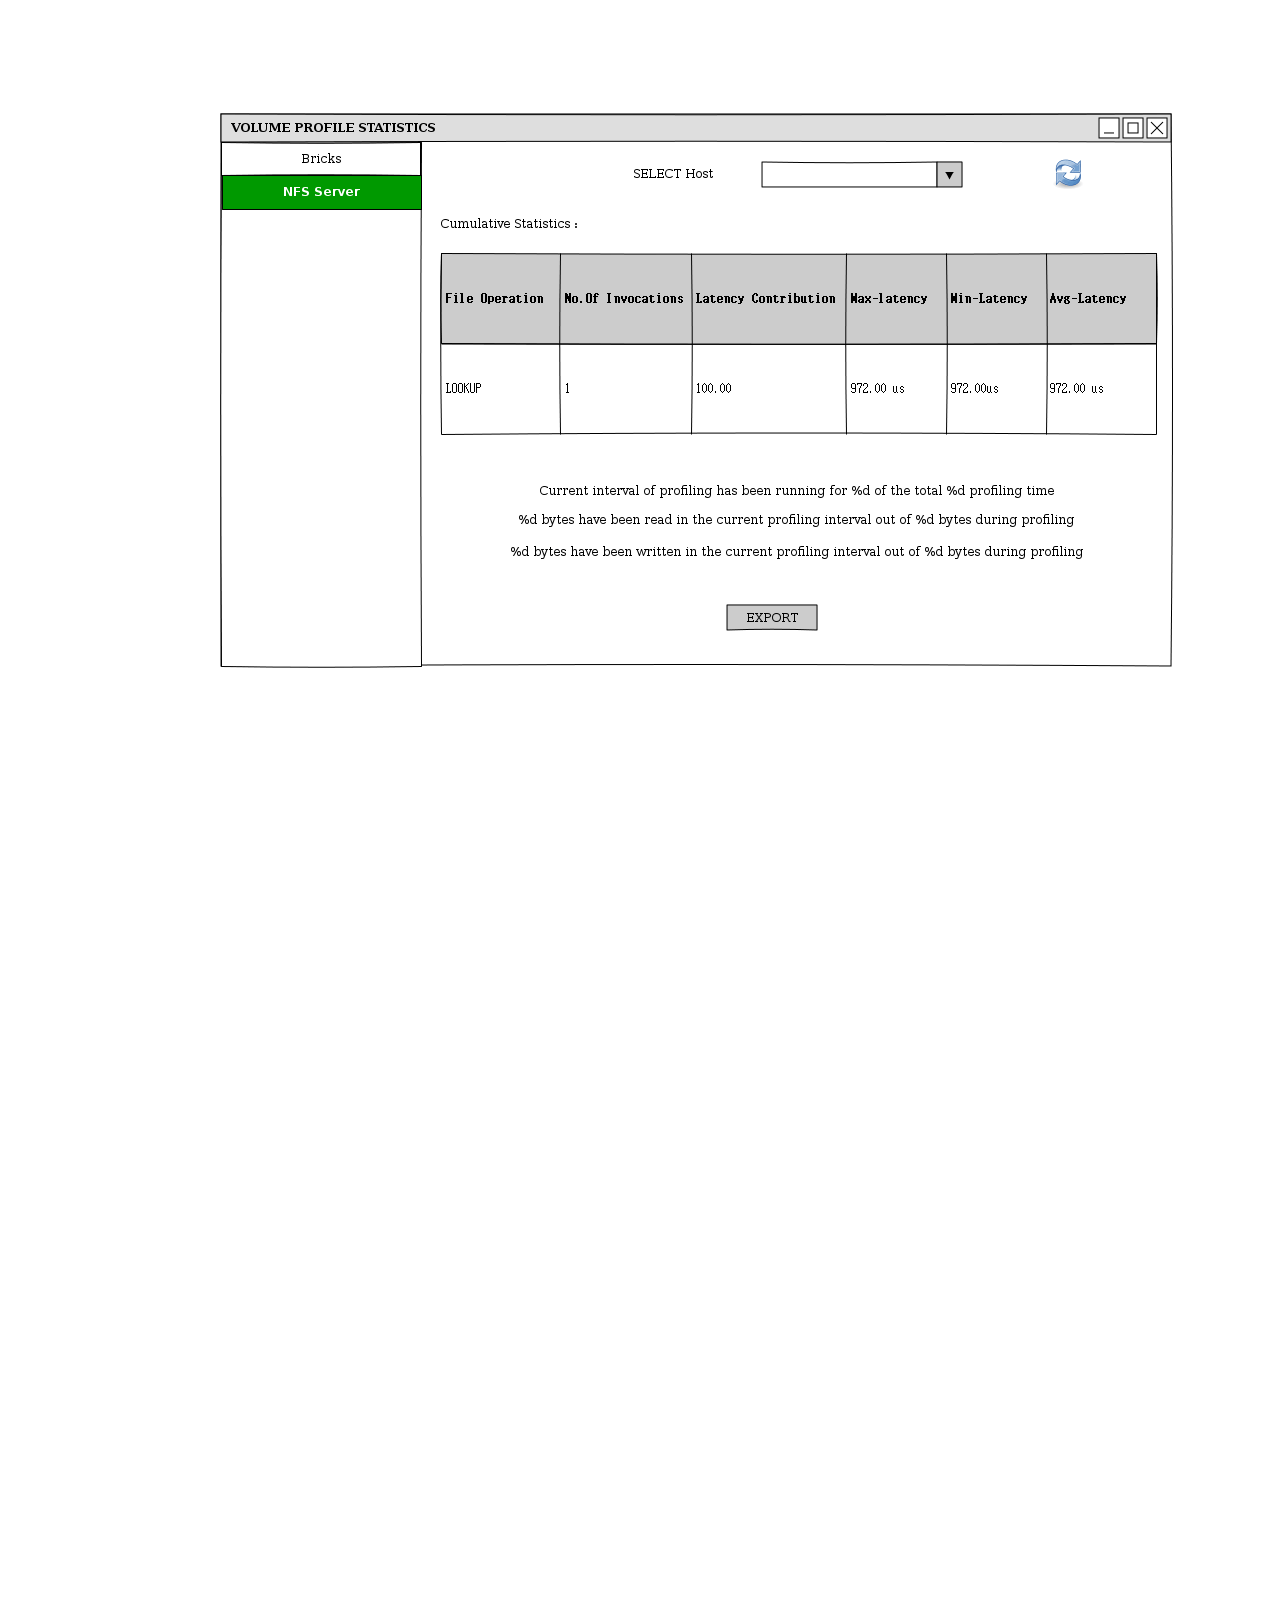
- User can choose to export the data returned for the sampling interval using the “Export” button
- User can refresh the profile data using the “Refresh” icon
REST API
- GET:
/api/clusters/<cluster_id>/glustervolumes/<volume_id>/profilestatistics
 <profileinfo>
      <profilestatstype>CUMULATIVE|INTERVAL</profilestatstype>
      <duration>..</duration>
      <totalbytesread>..<totalbytesread>
      <totalbyteswrite>..<totalbyteswrite>
      <blockinfo>
      <blockstatistics>../</blockstatistics>
      <blockstatistics>../</blockstatistics>
      </blockinfo>
      <fopinfo>
            <fopstatistics>...</fopstatistics>
      <fopstatistics>...</fopstatistics>
      </fopinfo>
</profileinfo>
- POST:
/api/clusters/<cluster_id>/glustervolumes/<volume_id>/startprofiling - POST:
/api/clusters/<cluster_id>/glustervolumes/<volume_id>/stopprofiling
HOW TO
- Create a gluster volume using the Volumes tab or you can use an existing volume
- Start profiling on the volume by clicking on “Profiling” sub tab after selecting the volume
- Mount the volume using NFS or any other client if not already mounted and perform some read/write operations on it
- You can now view the profile statistics using “Profiling” sub tab or the API