Most of them are outdated, but provide historical design context.
They are not user documentation and should not be treated as such.
Documentation is available here.
Gluster Dashboard
Summary
Dashboard will show an overview of all the entities in the system. It gives a consolidated view of the whole system., also helps the administrators to know the areas where his intervention is needed.
This document describes the design of a dashboard for Gluster. Dashboard will be developed as an UI Plugin using the Ovirt UI Plugin Infrastructure and Ovirt REST API.
Owner
- Feature owner: Ramesh Nachimuthu rnachimu@redhat.com
Current Status
- Status: In Progress
- Last updated date: Thu October 16th 2014
Design
Dashboard will show a summary of all the gluster entities currently being managed by oVirt like Hosts, Volumes and Bricks. It will be developed as an UI Plugin using Angular JS and Ovirt REST API. Following screen shot will give an idea about how the dashboard will look like.
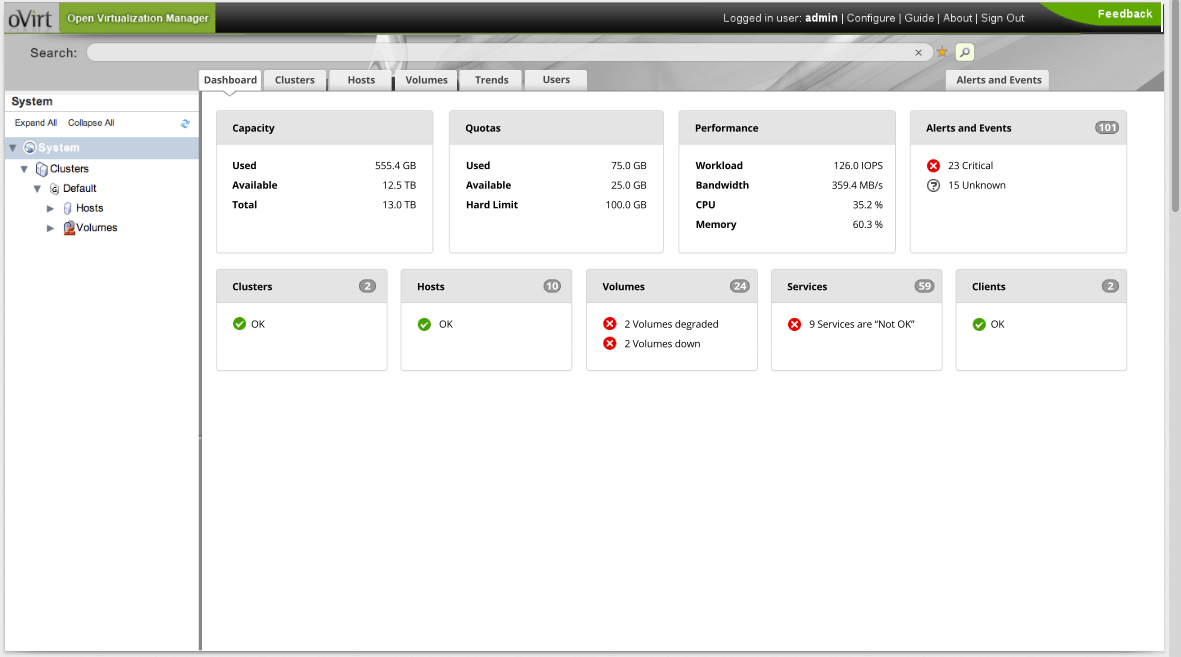
Dashboard Items
Capacity
It will show the Total, Used and Available storage capacity in the system. Its calculated by aggregating data from all the clusters.
Performance
This will show the average usage percentage of CPU, Memory, Bandwidth. This will averaged across all the hosts in system.
Alerts and Events
This will show the number of alerts and events in the system. It will have the link to navigate to Events tab.
Cluster
This will show the number of Clusters in the system and the number of clusters in down/down graded state.
Host
This will show the total number of Hosts in the system and the number of hosts in down state
Volumes
This will show the number of total volumes in the system across all cluster and number of them in down and down graded status.
Services
This will show the status of services running in the system.